#34 - Bitcoin Graph Watch
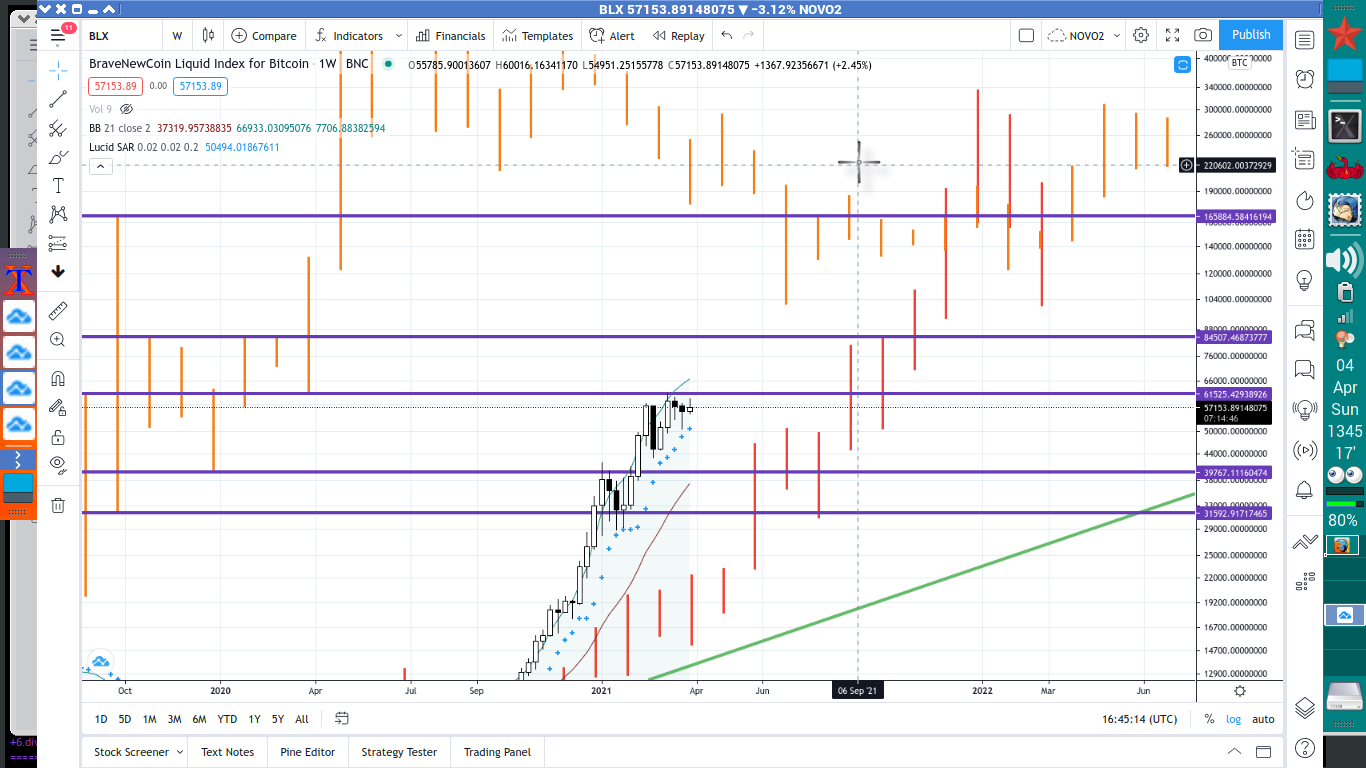
Produzi este gráfico com os índices da BLX e marcações de pontos de resistência de várias fontes. Penso em vender um pouco do meu hodl quando for a hora pois viso a diversificação de bens (eqüidade) líqüidos, como ações, títulos e cash.
Warning: this is not a financial recommendation. Please DYOR!!!
Yellow bars are clones from the 2014 peak and red bars are from the 2017 peak. I aligned the previous peak of each of these points (2011 and 2014, respectively) to the BLX index candlestick graph.
Horizontal lines I reckon I got from some issue of Bloomber Crypto. That is actually a very good and dependable resource. Bloomberg is always clear when sharing their data analysis of Bitcoin.
I also set Bollinger Bands, as reccomended by Didi Aguiar from DojiStar, a Brazilian analyst. The green support line is a long-term trend line with the first point on September 2015 and the bottom of March 2020.
I reckon we go up from here and I plan to start selling close to or at Max Keiser prediction of 220K Bitcoin this year.
Just selling a portion of my hodl so I can further reinvest in other liquid assets such as stocks, bonds and cash. I am very interested about diversification of my equity, as Ugly Old Goat would say.
This year, I started thinking about my retirement because it will take a long time to prepare for that, so better if I start doing something for it ASAP. There are some great videos of Tyler Jenks on retirement which I will be watching again..
There is also a great investor in Brazil who teaches a lot about a retirement wallets, the great Luiz Barsi.